


Labour increase majority on Exeter Council
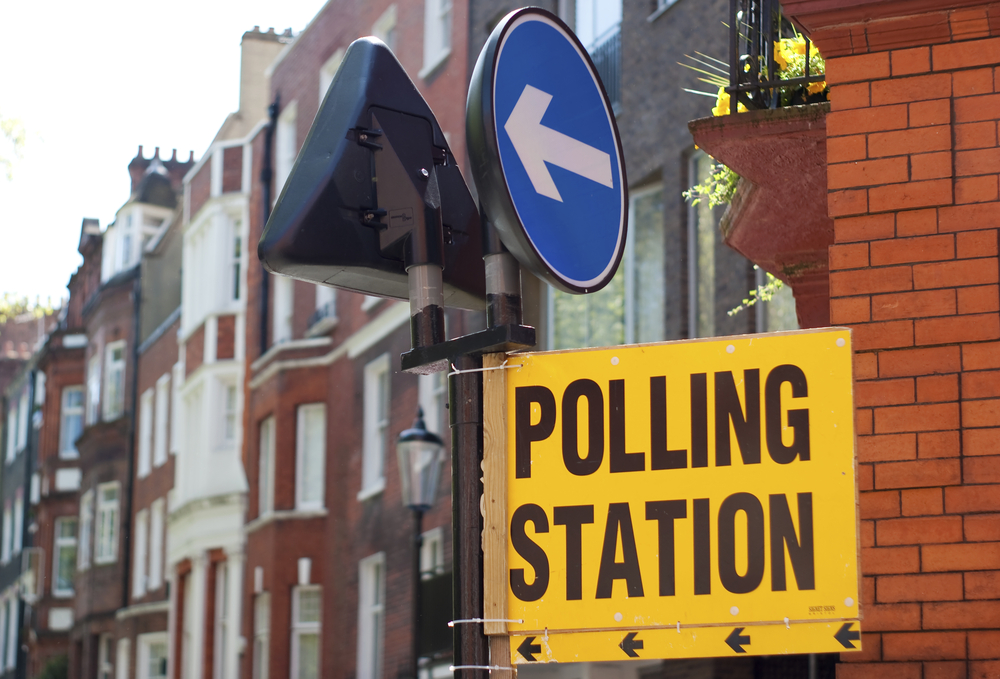
The Labour party has retained control of Exeter City council following yesterday’s elections.
Thirteen council seats were up for up for grabs in the election including seven from Labour, three from the Conservatives and two from the Liberal Democrats.
Labour gained two additional seats taking a ward from the Conservative and one wards from the Liberal Democrats.
Local Conservative group leader Yolanda Henson lost her seat in Polsloe to Labour's Christine Elizabeth Raybould-Gooding.
Following the election the Labour hold the majority with 27 Seats, Conservatives hold 10 Seats while the Lib Dem 3 Seats.
Ukip came third 13.9% of the overall vote but no Ukip councillors have been elected to the council.
Labour
Heavitree - ELECTED Olwen Foggin (Lab) 89
Newtown - ELECTED Roger Spackman (Lab) 735 votes
Whipton Barton - ELECTED Pete Edwards (Lab) 1029 votes
Priory - ELECTED Lesley Robson (Lab & Co-op) 1110 votes
Pinhoe - ELECTED Megan Williams (Lab) 862 votes
Alphington - ELECTED Suaad George (Lab) 808 votes
Cowick - ELECTED Heather Morris (Lab) 813 votes
Mincinglake - ELECTED Stephen Brimble (Lab & Co-op) 735 votes
Exwick - ELECTED Rachel Sutton (Lab) 870 votes
Polsloe - ELECTED Christine Raybould-Gooding (Lab) 709 votes
Conservative
Pennsylvania - ELECTED Peter Holland (Con) 772
Duryard- Lee William MOTTRAM (Con) 796 votes
Liberal Democrat
St Davids's - ELECTED Stella Brock (Lib Dem) 500 votes
Overall Election turnout was 41%.
Breakdown
Alphington
Turnout: 38.48%
Candidate's Name Party Votes Elected?
Peter Jonathan COX The Conservative Party Candidate 583 No
Dutch DUDGEON The UK Independence Party (UKIP) 529 No
Suaad GEORGE Labour Party Candidate 808 Yes
Diana Frances MOORE Green Party 261 No
Rod RUFFLE Liberal Democrats 384 No
Duryard
Turnout: 30.93%
Candidate's Name Party Votes Elected?
David BARKER-HAHLO Green Party 330 No
John CHILVERS Labour and Co-operative Party Candidate 338 No
Marcel GOLTEN Trade Unionists and Socialists Against Cuts 28 No
Lee William MOTTRAM The Conservative Party Candidate 796 Yes
Nigel David WILLIAMS Liberal Democrat 173 No
Heavitree
Turnout: 46.12%
Candidate's Name Party Votes Elected?
Olwen FOGGIN Labour Party Candidate 897 Yes
Debbie FRAYNE Green Party 284 No
Aric GILINSKY Conservative Party Candidate 483 No
David SMITH An Independence From Europe 121 No
Sam TAYLOR-WICKENDEN Trade Unionists and Socialists Against Cuts 20 No
Ditch TOWNSEND Liberal Democrats 219 No
Mincinglake
Turnout: 36.02%
Candidate's Name Party Votes Elected?
Stephen BRIMBLE Labour and Co-operative Candidate 753 Yes
Harry CHAMBERLAIN The Conservative Party Candidate 369 No
Kevin Martin CHUN Liberal Democrat 92 No
Isaac PRICE-SOSNER Green Party 228 No
Newtown
Turnout: 44.19%
Candidate's Name Party Votes Elected?
Caroline ELSOM The Conservative Party Candidate 244 No
Jackie HOLDSTOCK UK Independence Party (UKIP) 185 No
Tom MILBURN Green Party 260 No
David John PARKS Left Unity 39 No
Patrick RICHMOND Liberal Democrat 114 No
Roger SPACKMAN Labour and Co-operative Party Candidate 735 Yes
Pennsylvania
Turnout: 48.87%
Candidate's Name Party Votes Elected?
Peter Geoffrey HOLLAND The Conservative Party Candidate 772 Yes
Alfie LETHBRIDGE Trade Unionists and Socialists Against Cuts 97 No
Timothy Vaughan PAYNE Liberal Democrat 567 No
Daniel RICHARDS Labour Party Candidate 484 No
Pinhoe
Turnout: 46.89%
Candidate's Name Party Votes Elected?
Keith Montgomery CRAWFORD UK Independence Party (UKIP) 460 No
Cynthia THOMPSON The Conservative Party Candidate 828 No
Helen WEBSTER An Independence From Europe 23 No
Sally Elizabeth WILCOX Liberal Democrat 71 No
Megan WILLIAMS Labour Party Candidate 862 Yes
Lizzie WOODMAN Green Party 116 No
Polsloe
Turnout: 44.82%
Candidate's Name Party Votes Elected?
John William BOSWORTH Liberal Democrat 109 No
Rouben FREEMAN Green Party 303 No
Ralph GAY UK Independence Party (UKIP) 150 No
Yolonda Anne Cullis HENSON Conservative Party Candidate 574 No
Edmund James Matthew POTTS Trade Unionists and Socialists Against Cuts 30 No
Christine Elizabeth RAYBOULD-GOODING Labour Party Candidate 709 Yes
Priory
Turnout: 40.23%
Candidate's Name Party Votes Elected?
Jesse Andrew Neil DODKINS Trade Unionists and Socialists Against Cuts 16 No
Nicola GUAGLIARDO UK Independence Party (UKIP) 721 No
Paul KENNY The Conservative Party Candidate 504 No
Caroline NOTTLE Liberal Democrat 97 No
Lesley Sara ROBSON Labour and Co-operative Party Candidate 1110 Yes
Chris STONE British National Party 38 No
Alex TAYLOR Green Party 189 No
St.David’s
Turnout: 38.09%
Candidate's Name Party Votes Elected?
Andrew BELL Green Party 320 No
Stella Rose BROCK Liberal Democrat 500 Yes
Luke PILLING Trade Unionists and Socialists Against Cuts 26 No
Lizzie ROBERTS The Conservative Party Candidate 182 No
Colin STEWART UK Independence Party (UKIP) 160 No
Natalie VIZARD Labour Party Candidate 451 No
Whipton Barton
Turnout: 40.16%
Candidate's Name Party Votes Elected?
Mike CAMP An Independence From Europe 28 No
Christopher CARTER The Conservative Party Candidate 437 No
Mark COX Green Party 141 No
Pete EDWARDS Labour Party Candidate 1029 Yes
Adrian Rudd ROGERS UK Independence Party (UKIP) 557 No
Pamela Margaret THICKETT Liberal Democrat 104 No