


2012 England's wettest year since records began
According to provisional statistics gathered by the Met Office, 2012 was the second wettest year for the UK in the national record dating back to 1910.
The total annual rainfall was 1330.7 mm, which is just 6.6 mm short of the record set in 2000.
In what has been an exceptionally wet year across the UK, accurate forecasts and warnings from the Met Office have helped us all to plan, prepare and protect ourselves from the worst impacts of the extremely wet weather we have seen.
Looking at individual countries, 2012 was the wettest year on record for England, third wettest for Wales, 17th wettest for Scotland and 40th wettest for Northern Ireland.
Interestingly, this adds to a high frequency of wet years since 2000 in the UK – with four of the top five wettest years occurring since then.
Top five wettest years in the UK
2000 – 1337.3mm
2012 – 1330.7mm
1954 – 1309.1 mm
2008 – 1295.0mm
2002 – 1283.7mm
In what has been an exceptionally wet year the Met Office has worked closely with partners in the Environment Agency, Scottish Environment Protection Agency and Highways Agency helping them to successfully manage the at times very challenging impacts that the weather has brought them.
Accuracy:
- In what has been an exceptionally wet year Met Office forecasts have risen to the challenge with rainfall forecasts correct 72% of the time, well above its target of 60%. (It is difficult to forecast rainfall at a pinpoint location, therefore the target for this element is not as high as for others. For example, one location may have rain and a location a mile away may remain dry.)
Met Office forecasts have never been so important and surveys have shown that 76% of the public think its forecasts are accurate and 90% find them useful in helping them plan, prepare and protect themselves from the weather.
|
PROVISIONAL |
mean temperature |
sunshine duration |
precipitation |
|||
|
2012 |
Actual |
Difference from 1981-2010 average |
Actual |
Percentage of 1981-2010 average |
Actual |
Percentage of 1981-2010 average |
|
|
|
|
|
|
|
|
|
|
degC |
degC |
hours |
% |
mm |
% |
|
Regions |
|
|
|
|
|
|
|
UK |
8.8 |
-0.1 |
1356.4 |
99 |
1330.7 |
115 |
|
England |
9.6 |
-0.1 |
1470.2 |
98 |
1123.2 |
131 |
|
Wales |
9.1 |
0.0 |
1355.7 |
97 |
1716.2 |
118 |
|
Scotland |
7.3 |
-0.1 |
1187.6 |
100 |
1602.6 |
102 |
|
N Ireland |
8.9 |
0.0 |
1239.1 |
99 |
1153.7 |
102 |
|
England & Wales |
9.5 |
-0.1 |
1454.4 |
98 |
1205.0 |
128 |
|
England N |
8.8 |
-0.1 |
1360.0 |
99 |
1288.1 |
133 |
|
England S |
10.0 |
-0.1 |
1528.5 |
98 |
1036.0 |
130 |
|
Districts |
|
|
|
|
|
|
|
Scotland N |
6.9 |
-0.2 |
1124.9 |
104 |
1599.5 |
93 |
|
Scotland E |
7.1 |
-0.1 |
1217.1 |
96 |
1313.2 |
111 |
|
Scotland W |
8.1 |
0.0 |
1239.1 |
99 |
1917.1 |
107 |
|
Eng E & NE |
8.8 |
-0.1 |
1420.3 |
100 |
1064.0 |
137 |
|
Eng NW & Wales N |
8.8 |
-0.1 |
1305.0 |
97 |
1614.1 |
122 |
|
Midlands |
9.4 |
-0.1 |
1439.2 |
100 |
1074.6 |
135 |
|
East Anglia |
10.1 |
-0.1 |
1538.1 |
98 |
804.1 |
129 |
|
Eng SW & Wales S |
9.8 |
-0.1 |
1457.3 |
96 |
1574.0 |
125 |
|
Eng SE & Central S |
10.3 |
-0.1 |
1601.5 |
98 |
999.7 |
127 |
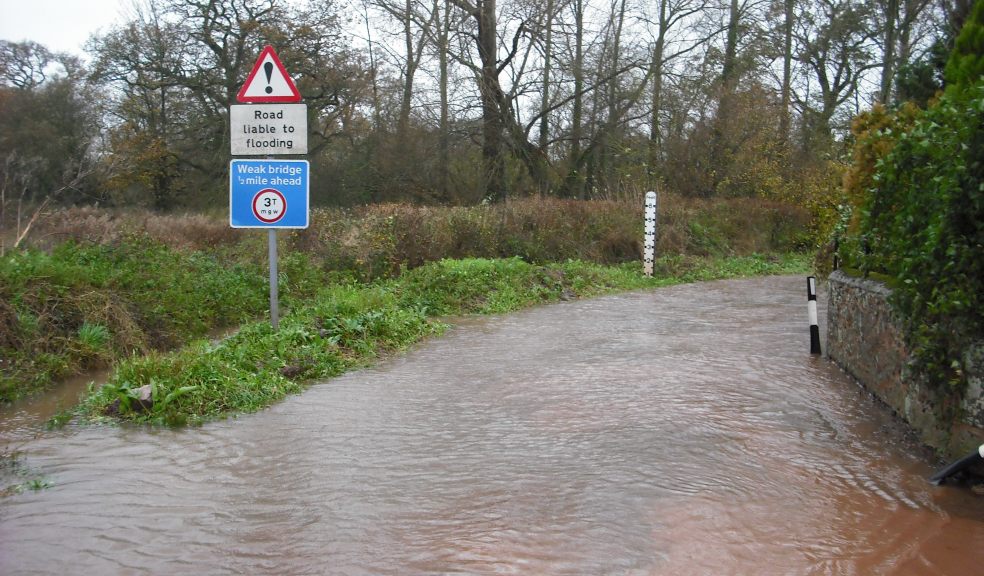
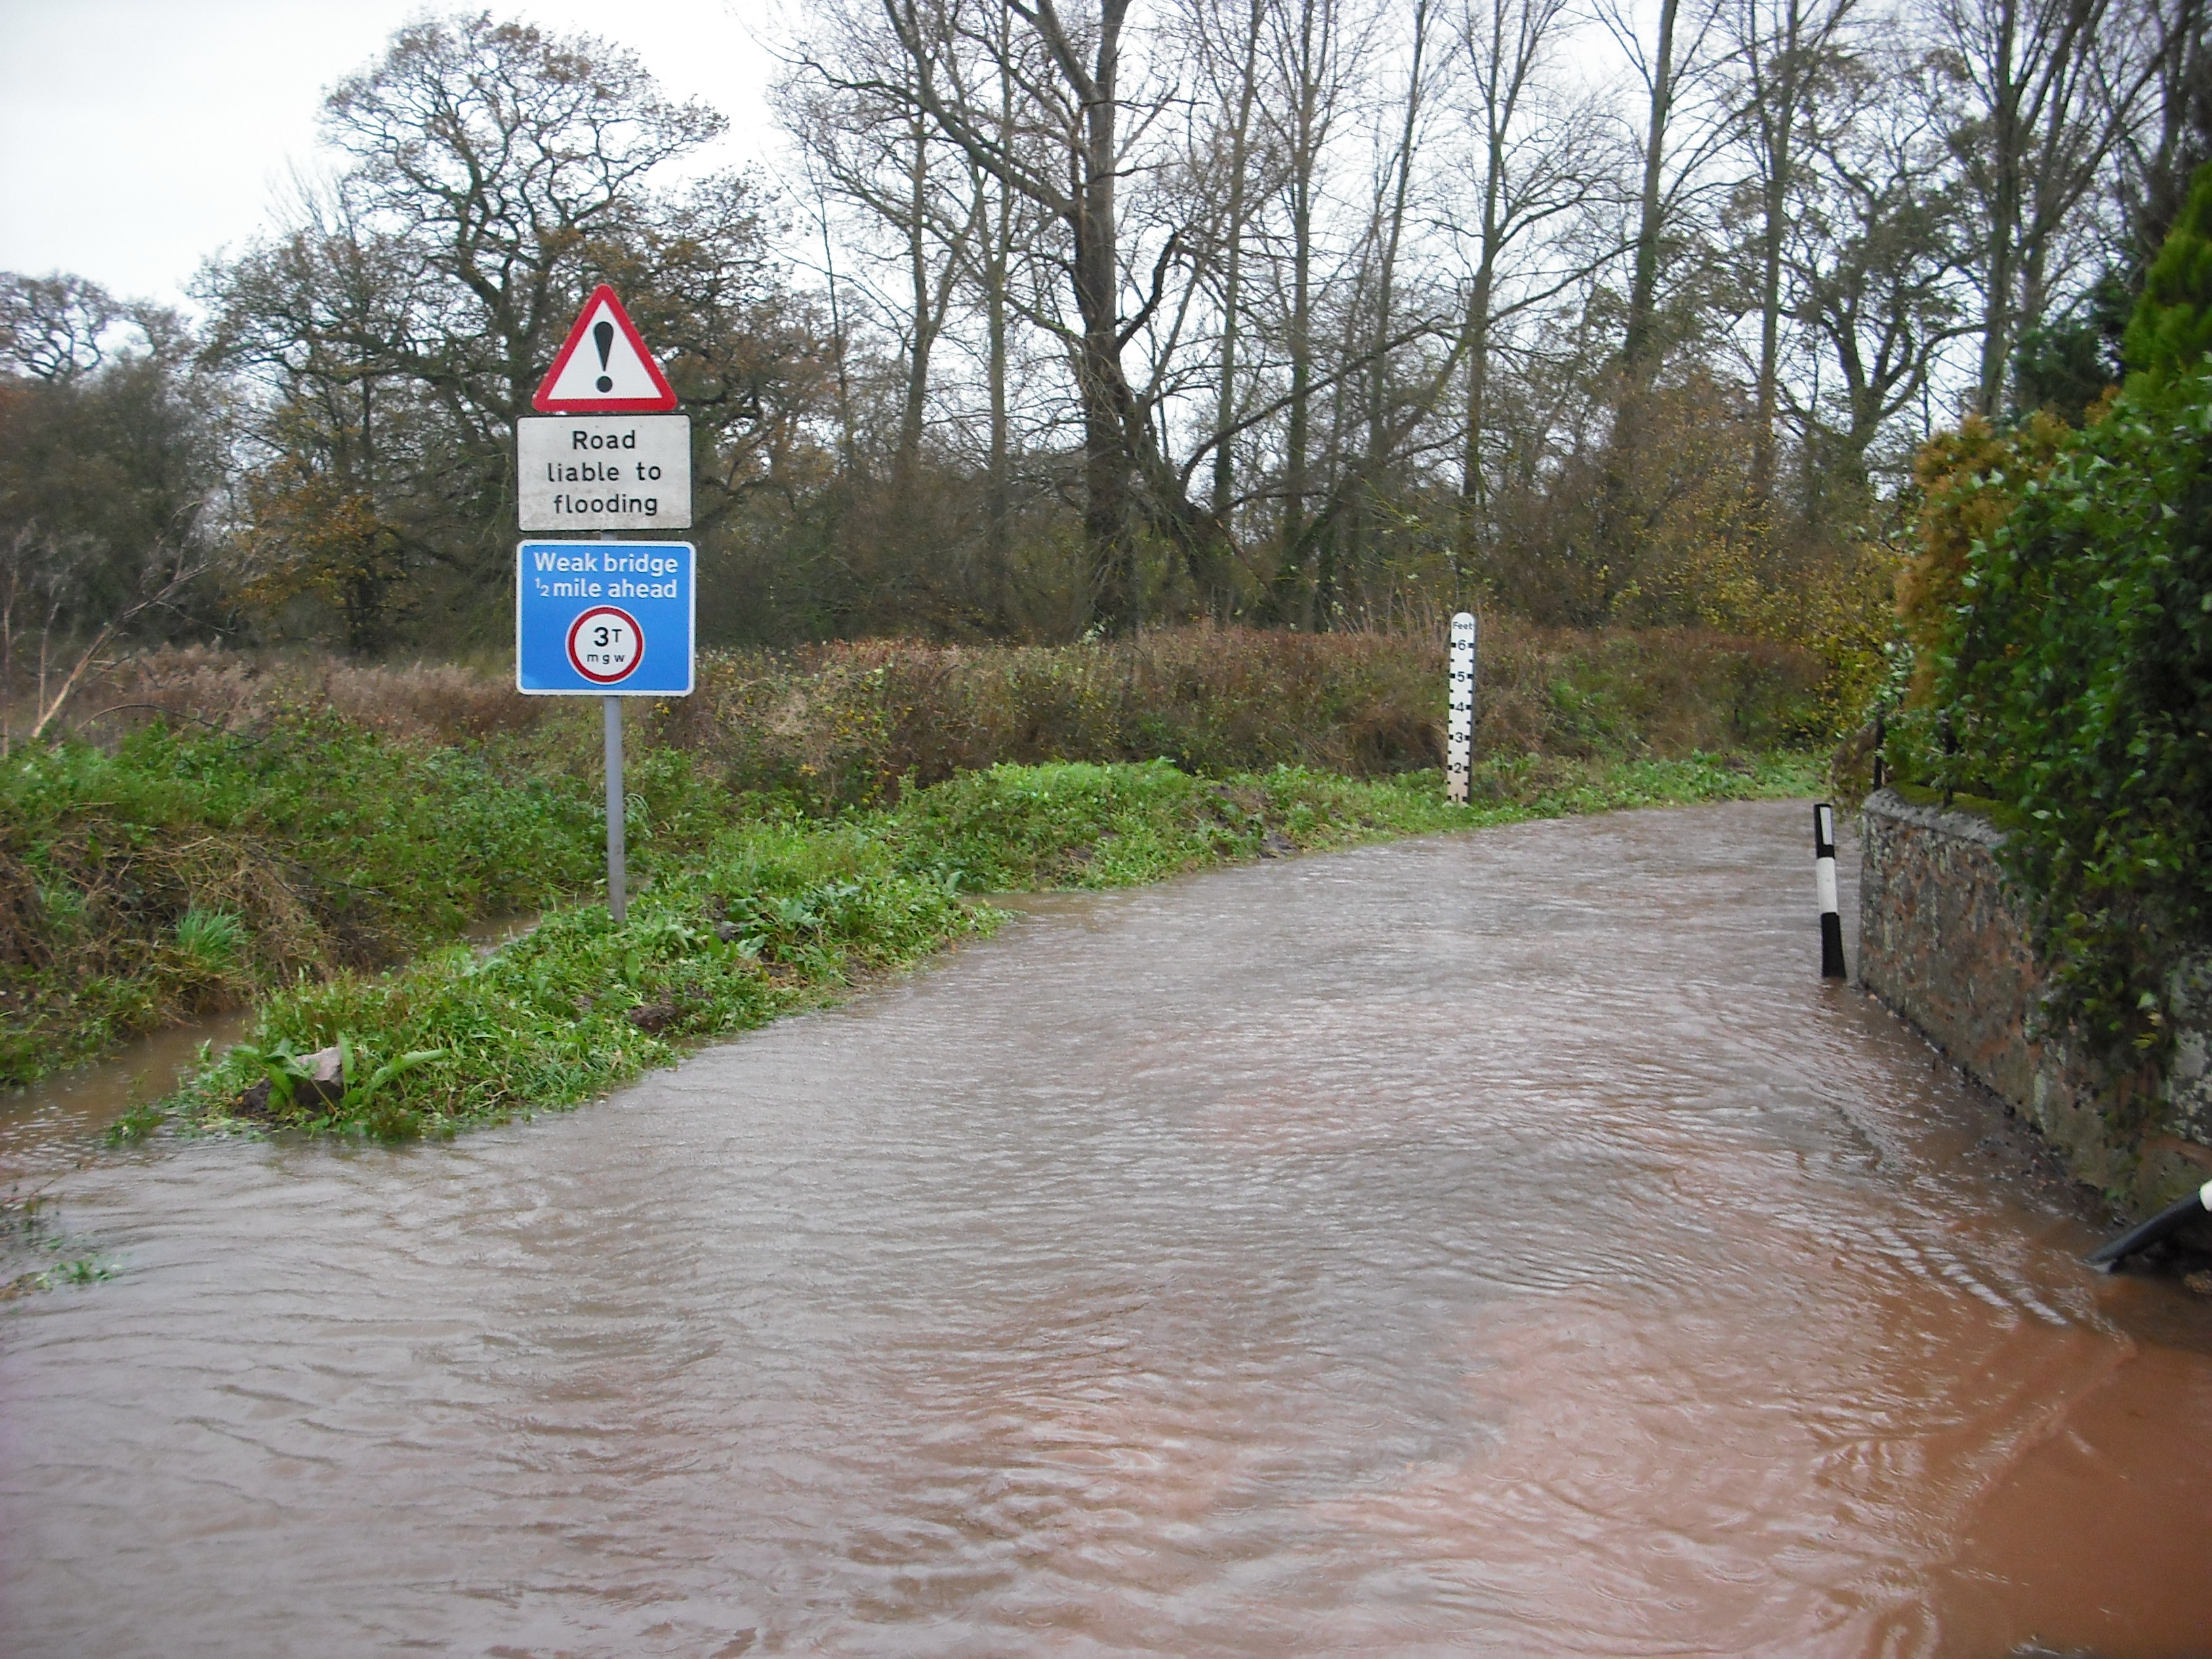
In the run-up to Christmas, South-West England was particularly badly affected, with a number of railway lines remaining closed over the entire festive period.
The Environment Agency said almost 8,000 properties in England and Wales were flooded during 2012 and it sent more than 200,000 warnings to households and businesses.
However, it added that flood defences had protected more than 200,000 properties in at-risk areas.
")