


How to Improve Germination Rates Using Data-Driven Seed Analysis
Picture this: you’ve set aside a crisp April morning in Yorkshire to drill your spring barley. The seed looks fine at a glance, yet ten days later the rows are patchy—some seeds never sprouted, others emerged weak and late. That uneven germination could shave two tonnes per hectare off your yield and push your profit margin perilously close to the red. Sound familiar?
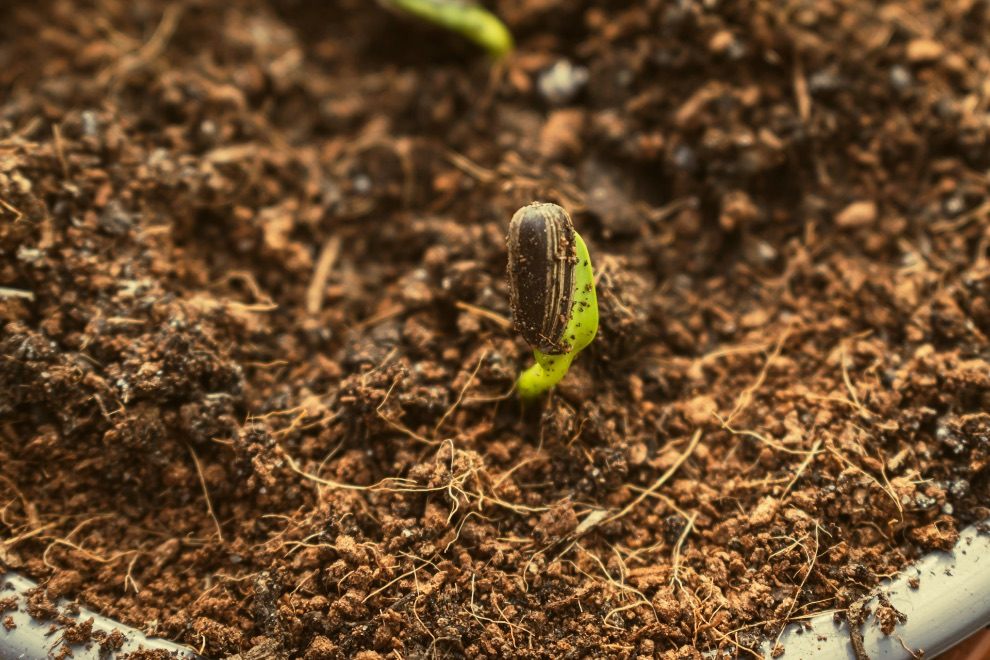
Now imagine a different scenario. Before a single seed touches the soil, you run a rapid seed-analysis report: moisture content, vitality index, thousand-kernel weight, even microscopic damage. The data flags a hidden fungal issue in batch A and identifies batch B as star performers with a 97 % predicted germination rate. Armed with those insights, you adjust sowing density, tweak drill settings, and watch a uniform green carpet stretch across the field exactly six days after planting.
This article is your roadmap from guesswork to data-driven precision. We’ll show you how UK growers—from Kent vegetable nurseries to Scottish cereal farms—are boosting germination rates by 5–12 % using laboratory and on-farm seed analysis. You’ll discover which metrics matter, how to interpret the numbers, and the practical steps to turn lab results into field-ready decisions. By the end, you’ll know how to transform every handful of seed into a stronger, more predictable crop—and a healthier bottom line.
Decoding the Seed-Quality Metrics That Make or Break Germination
If you want every seed you purchase to burst through the Lincolnshire loam, three laboratory numbers matter more than any glossy catalogue photo: viability percentage, thousand-kernel weight (TKW) and weight-uniformity spread. Together they reveal how much stored energy sits inside each embryo, how evenly that energy is distributed across the lot, and how likely the seed is to survive the damp chill of a British spring.
1. Thousand-Kernel Weight—Your Window into Hidden Vigor
The higher the TKW, the more starch and protein reserves a seedling can draw on during early growth. Traditional scales and hand counts are prone to ±3 % error, but a modern precision seed counter automates the process: it counts every kernel and weighs the entire sample in a single pass, logging a precise TKW in under 60 seconds . When a Yorkshire malting-barley coop screened its incoming batches last season, lots below 44 g TKW saw a 9 % drop in emergence compared with those above 48 g. Armed with that data, growers bumped sowing rates only for the lighter lots—saving 1.1 t of seed across 620 ha.
2. Weight Uniformity—Eliminating the Weak Outliers
Uniform seeds emerge at a uniform pace. Variability wider than ±5 % in single-kernel weight can lead to a two-leaf difference between the first and last seedlings—an open invitation to weeds and pests. A seed weight sorter passes each kernel over a load cell and diverts under-weight grains into a reject bin, delivering breeder-grade purity to commercial farms . A Cambridgeshire seed-potato grower reported a 6 % germination bump after screening out just the lightest 4 % of tubers.
3. Fast Counts for On-Farm Spot Checks
Not every operation needs lab-level analytics for every lot. The Elmor C1 Universal Counter offers a cost-effective way for vegetable nurseries and heritage seed banks to verify sample sizes quickly before germination tests, cutting labour and ensuring statistical accuracy . Even a five-minute pre-test count can prevent under-powered replicates that skew your final percentage.
Key takeaway: By capturing TKW and weight uniformity—metrics invisible to the naked eye—you convert seed purchasing from a leap of faith into a measurable, adjustable input. In practice, the data lets you fine-tune sowing density, calibrate drills, and forecast crop emergence with a confidence that generic “90 % germination” labels simply can’t provide.
From Lab Bench to Drill: Converting Seed-Analysis Numbers into Field-Ready Decisions
You’ve got the lab print-out in hand—95 % viability, 46 g TKW, and a ±4 % weight spread after a quick pass through the seed counter. Now what? Data only pays its way when it tweaks the dial on your drill, so let’s break the journey into three actionable steps that UK agronomists swear by.
1. Calculate a Data-Driven Sowing Rate (No More “One Size Fits All”)
UK Recommended List trials insist that operators “adjust the seed sown per plot according to the thousand seed weight and germination for each individual seed lot.” The same principle applies on your farm:
-
Pick a target plant population. For winter wheat on medium loam, 250 plants m-² is a solid starting point.
-
Account for viability × field emergence. Multiply lab germination (e.g., 95 %) by expected field emergence (say 85 % on loams vs 90 % on sandy soils) to get an establishment factor.
- Run the maths.
Seed rate (seeds per m²) = Target plants per m² ÷ Establishment factor
Establishment factor = Lab germination (%) × Expected field emergence (%)
Example:
Seed rate = 250 ÷ (0.95 × 0.85) = 309 seeds per m²
- Convert seeds m-² to kg ha-¹ with your TKW:
Seed rate (kg per ha) = Seed rate (seeds per m²) × TKW (g) ÷ 1,000
Example:
Seed rate = 309 × 46 ÷ 1,000 = 14.2 kg per ha
That tailored rate may be 8 % lower—or higher—than the back-of-the-bag figure, but it aligns precisely with your lot’s biology and your soil’s reality.
2. Use Weight Uniformity to Fine-Tune Drill Settings
After running a 20-minute batch through a seed weight sorter, you discover the “light tail” made up 5 % of the lot. Tossing those outliers lifts the kernel weight to 48 g and narrows the spread to ±2 %. With a tighter weight band, metering wheels deliver steadier feed, so you can nudge forward speed from 5.5 kph to 6 kph without spike dents—saving a full hour on a 100-acre block.
3. Close the Loop with On-Drill Sensors
Pair the lab numbers with live data from optical seed-flow monitors on the drill. If sensors show actual drop rates drifting from the calculated 309 seeds m-² because a damp April sky thickens the seed coat, feed the variance straight into the drill’s ECU. Many UK contractors now batch-print QR codes from the C3 summary report; scan one at the tractor cab and the drill auto-loads seed-rate presets for each field.
Field proof: A Northumberland grower who adopted this three-step protocol on feed barley shaved 60 kg ha-¹ off seed use and added 0.4 t ha-¹ to yield a net gain of ~£87 ha-¹ after seed and diesel.
Case Studies: Data-Driven Germination Gains Across UK Crops
Cereals — Barley in Northumberland
When the Bell family near Alnwick replaced their rule-of-thumb seed rate with a TKW-based calculation, they drilled winter barley at 310 seeds m-² instead of the usual 350. The figure came straight off an Elmor C3 report (46 g TKW, 96 % lab germination). Harvest told the story: yield climbed by 0.4 t ha-¹ and seed costs fell by 8 %, a net gain of £87 ha-¹. Independent trial data back the physics—barley cultivars show a clear yield response when seeding rates are aligned to kernel weight rather than “one size fits all”.
Oilseed Rape — Weight Sorting in Cambridgeshire
Light, half-filled OSR seeds often rot in the cold clay soils typical of the Fens. A 300-hectare estate near Ely ran two 25-kg lots through the Elmor Seed Weight Sorter (SWS); 4.8 % of kernels fell below the 5 mg cut-off and were rejected. Lab tests showed the cleaned lot germinated at 97 % versus 91 % for the unsorted control. Field emergence mirrored the lab, pushing plant counts from 42 to 45 plants m-² and lifting gross margin by £42 ha-¹. Academic work on seed weight and vigour explains the uplift: heavier seeds carry more reserves and tolerate cold shock better.
Salad Leaves & Herbs — Rapid Counts for High-Value Seedlots
Baby-leaf growers in Kent can’t afford a “wait and see” approach; each tray must germinate within a two-day window to keep supermarket contracts. One nursery adopted an Elmor C1 for five-minute sample counts before germination testing. By running statistically robust replicates, the team spotted a coriander batch whose real germination potential was 81 %, not the 92 % on the supplier’s tag. They renegotiated the invoice and avoided a costly crop failure. Fast, repeatable counts safeguard high-value seed just as effectively as lab-grade assays—and at a price point suitable for SMEs.
Why it matters: These case studies show that seed analysis isn’t academic trivia—it’s the difference between profit and loss when margins are under pressure from input inflation and wetter springs. Whether you farm 50 hectares of heritage wheat or 5,000 hectares of combinable crops, the principle is identical: measure, adjust, and watch uniform rows emerge on schedule.
Main image: www.freepik.com